Hendrix Genetics increased modeled revenue by 1.4% to 1.8% across two Brazil line benchmarks with SWARM ENGINE
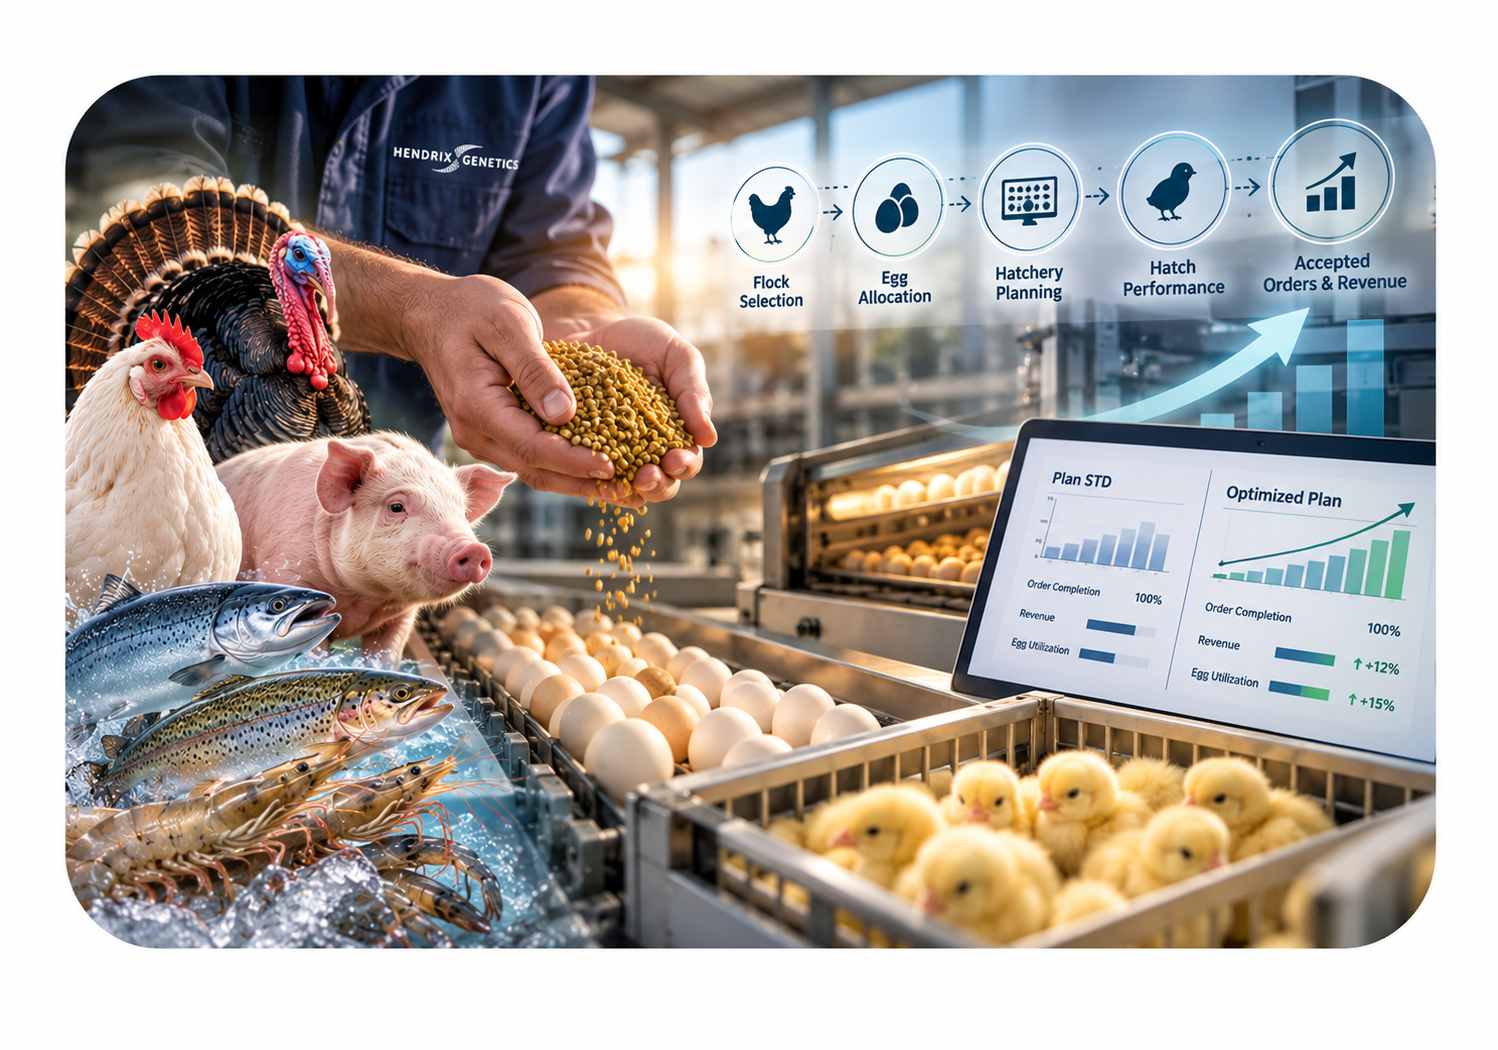
Across two lines in Brazil, SWARM ENGINE compared optimized flock and egg allocation with Hendrix Genetics’ standard plan. The model completed the same benchmark orders while improving projected revenue, hatch performance, and egg utilization.
CUSTOMER
Hendrix Genetics is a global animal breeding and genetics company with programs in laying hens, turkeys, traditional poultry, swine, salmon, trout, and shrimp. Founded in 2005, it operates in more than 25 countries, including Brazil. This study concerns a localized poultry planning benchmark on two lines in Brazil, not the company’s global operations.
Industry: Animal breeding and poultry genetics
Focus: Flock selection, egg allocation, hatch performance, and accepted order revenue
Region: Two poultry lines in Brazil
Use Cases: Hatchery planning and order allocation under capacity constraints
Hendrix Genetics

CHALLENGE
Hendrix’s standard plan, identified in the benchmark as Plan STD, scheduled forecasted orders using fixed flock selection rules and historical conversion assumptions. Across the two Brazil lines, decisions had to account for available flocks, eggs, hatchery equipment, capacity, and differences in hatch performance. The benchmark explored whether an optimization model could improve those decisions for the same input orders.
Biological variation: Flocks can yield different hatch outcomes, so egg and flock choices affect the number of female chicks delivered.
Coupled capacity decisions: Egg assignment, incubator and hatcher use, and order acceptance must fit together within the available capacity.
Commercial trade-offs: A plan can meet the order book while leaving attainable revenue or better egg utilization unrealized.
The practical question was whether Hendrix could produce a higher-value feasible plan without sacrificing benchmark order completion.
Extracting more value from the same order book and available eggs

and order planning
with SWARM ENGINE
Optimize the same demand
Q1 2026 included 28 input orders, with 25 completed under both methods; the follow-up batch contained 8 input orders, all completed under both methods.
Use constrained capacity
The model weighed available flocks, eggs, incubator and hatcher equipment, and capacity while selecting a feasible plan.
Compare operational outcomes
The benchmark reported accepted order revenue, average HoS, eggs per female chick, egg inputs, and female chicks delivered.
Prepare for operational validation
The proposed next steps are a shadow run in a live planning cycle, a single Hendrix feedback owner, and a later production cutover decision.
Powered by the SWARM ENGINE
The SWARM ENGINE is our agentic AI optimization product for complex operational decisions such as logistics network design, routing, and supply chain planning.
LEARN MORE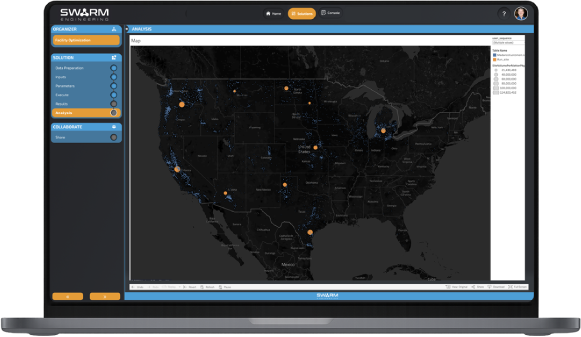
IMPACT
SWARM’s logistics network optimization platform continues to evolve alongside Ardent Mills operations. As planning inputs and business requirements shift, the SWARM Platform helps the team spot new opportunities for efficiency, resilience, and alignment.
1.4% to 1.8% higher modeled revenue
ENGINE produced $60,814 more accepted-order revenue in Q1 (+1.8%) and $20,053 more in the follow-up batch (+1.4%) than Plan STD. These are separate benchmark comparisons, not an annualized estimate.
1.46 to 1.81 percentage points higher average HoS
Average HoS rose from 32.43% to 33.89% in Q1 and from 31.74% to 33.56% in the follow-up batch. The source reports a 1.81 point June gain; the displayed values round to a 1.82 point difference.
3.5% to 7.3% fewer eggs per female chick
Eggs per female fell from 3.08 to 2.98 in Q1 and from 3.21 to 2.98 in the follow-up batch. In the smaller batch, ENGINE used 15,739 fewer eggs (382,633 versus 398,372), while the deck reports 4,441 more female chicks than Plan STD.
Modeled gains in both benchmark windows

Benchmark comparison for two Brazil lines
| Measure | Q1 2026 · Jan–Mar | Follow-up · June 2026 |
|---|---|---|
| Completed orders |
25 of 25 under both methods (28 input orders) |
8 of 8 under both methods |
| Accepted-order revenue |
+$60,814 (+1.8%) ENGINE $3.42M |
+$20,053 (+1.4%) ENGINE $1.43M |
| Average HoS |
33.89% vs 32.43% +1.46 points |
33.56% vs 31.74% +1.81 points reported |
| Eggs per female chick |
2.98 vs 3.08 −3.5% reported |
2.98 vs 3.21 −7.3% reported |
| Female chicks delivered | +15,608 (+5.1%) vs Plan STD | +4,441 vs Plan STD |
The female chick comparisons in the table are against Plan STD. No financial savings from reduced egg use were assigned because egg costs were not supplied.
These are modeled benchmark results for two Brazil lines, not measured live production gains. The follow-up data export has an internal Q1 label despite being described as June in the deck; its period should be confirmed with Hendrix before external publication. All customer claims and results require Hendrix approval for external use.
WHY SWARM
Why ENGINE
fits the planning problem
Joint decisions under capacity
ENGINE evaluated flock choice, egg allocation, equipment use, and accepted orders as one planning problem for the benchmarked lines.
More value from available inputs
The tested plans improved modeled revenue and hatch performance while using fewer eggs per female chick, with equal completed-order counts.
A measured route to production
The proposed next step is a shadow run against a live planning cycle, followed by review of differences and a mutually agreed cutover decision.
can do for
hatchery planning
Discuss how flock performance, eggs, equipment capacity, and order demand shape your planning decisions, and evaluate whether ENGINE can improve outcomes in a benchmark using your own operating inputs.